
How Ikshana Handles 3M Daily Events on Bare Metal with Zero Downtime
The Setup: 700 Cameras, 20TB, and No Internet
Averages lie. That’s the first thing worth saying about this deployment.
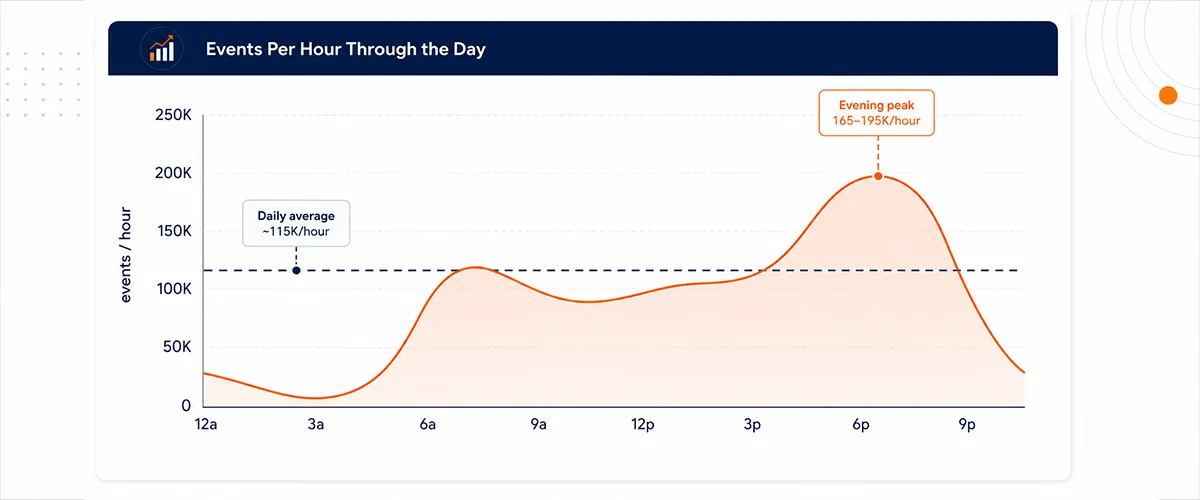
On paper the number looks tame: Ikshana processes 2.5 to 3 million events a day across 700+ cameras. Divide by 86,400 and you get ~35 events per second. That’s a number you could serve off a laptop. It’s also a number that describes exactly zero seconds of the actual workload.
These are city cameras. Real traffic on real roads, and cities have a rhythm. Between 4 and 7 PM the pipeline sees 150,000 to 200,000 events per hour — 40 to 55 per second sustained, with bursts well above that. Then at 3 AM it’s a trickle. You don’t size for the average. You size for the evening rush, and then you survive the quiet hours carrying whatever the rush left behind.
Now the constraints, because they’re the interesting part.
The site is air-gapped. No internet, no package index, no installing your way out of a problem.
There is no shared storage. No SAN, no NAS, no object store. Twenty terabytes spread across three bare-metal CPU boxes, each one owning its own disk and blind to the others.
The hardware is fixed. Seven servers, forever. No procurement, no shipping into an air-gapped site.
And it has to happen with zero downtime. The deployment is live. Cameras don’t pause for migrations. No maintenance window, no cutover at 2 AM on a Sunday, no spare cluster to swing traffic into. The system had to be rebuilt underneath itself while it was running.
That last one has a consequence nobody draws on the architecture diagram: you can’t restart anything to clean up after yourself. Processes that chew through millions of images and video clips accumulate memory. Normally you shrug and bounce them. Here, bouncing anything at peak means dropping events. So RAM stops being a resource and becomes a balance you carry — one that only moves in one direction. Assume that constraint everywhere below; it’s behind nearly every decision that follows.
The old architecture could handle this load. Just not on this hardware. Its answer to more events was more machines — centralize the backend, scale the boxes underneath it, and let procurement absorb the difference. That’s a perfectly good answer when procurement is an option.
So the real problem was never throughput. It was throughput at a fixed cost.
The Constraints Were the Architecture
There’s a version of this problem with an easy answer. Throw a NAS in the rack, point everything at it, scale the backend horizontally, install whatever queue-of-the-month makes the diagram cleanest. Every one of those escape hatches was welded shut before we wrote a line of code — and each one, on inspection, turned out to be pointing at a specific design decision.
No shared storage means shared-nothing processing. The instinct is to fight this — NFS-mount everything, elect a storage owner, build a mesh — and every one of those turns three independent disks into one distributed disk with three times the failure modes and a network hop on every write. So we stopped fighting it. If a server owns its disk, it should own everything that touches its disk: ingest, processing, writes, the whole path. Three machines that each believe they’re the only machine. The storage layout didn’t constrain the topology; it became the topology.
Air-gapped sounds like pure limitation, but it’s also a filter. You stop shopping and start reading: what’s actually installed, what’s it capable of, which knobs have we never turned? Most of what we needed was already sitting there unused — not because the tools are magic, but because the default configuration of anything is tuned for the average case, and we didn’t have an average case.
And when you can’t add machines, “make it faster” and “make it fit” collapse into the same sentence.
Put it together and the constraints stop reading like a list of problems and start reading like a specification: shared-nothing processing, on fixed hardware, using only what’s installed, migrated live, holding memory flat under a load that triples every evening. Nobody would choose to write that spec. But it’s remarkably unambiguous — most architectural arguments end before they start, because one of the four constraints has already answered the question. The design didn’t come from a whiteboard. It came from subtraction.
One Broker to Rule Them All: RabbitMQ as the Fan-Out Point
Here’s the part that looks like a contradiction. We just argued that a single centralized backend is what broke—and the fix starts with a single centralized broker. One RabbitMQ, seven servers, every event on the site passing through it.
The distinction is what each was asked to do. The old backend was a worker pretending to be a hub: accept the event, decode it, run the logic, write the file, serve the API. All unbounded work—the cost scales with the payload, and it all landed on one CPU and one disk. A broker does none of that. Take a message, make it durable, hand it to whoever asks. The work per event is small, fixed, and identical whether it’s a still frame at 3 AM or a clip from rush hour. That’s the whole trick: centralize the thing whose cost is constant, distribute the thing whose cost isn’t. Which is also why the peak doesn’t scare it — the evening surge is violent if each event means decode-process-write, and a slow afternoon to a broker on a machine that does nothing else.
The publishing side stays deliberately dumb. Events go in the same way regardless of who eventually handles them. No producer knows the topology — not that there are three storage servers, not which one has room, not which one is behind. That ignorance is load-bearing: it’s why we could rearrange the entire consumer layout underneath a live system without touching the thing generating the traffic.
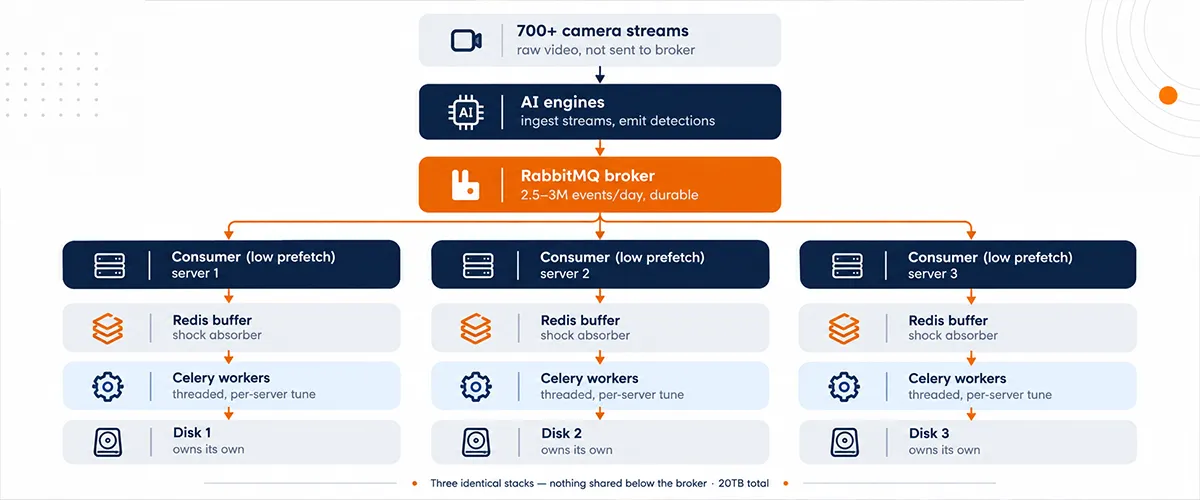
The fan-out is on the consumer side, and it’s mostly restrained. Three independent consumers, each feeding exactly one server’s stack. RabbitMQ’s default round-robin sounds like free load balancing until you remember these servers own different disks and fill at different rates — round-robin is only fair if the workers are identical, and ours are three machines with three separate 20TB commitments.
The real work was prefetch. Left at default, a consumer buffers a large batch into its own memory before acknowledging any of it, and now there’s a queue inside your queue, in RAM you can’t reclaim. At peak that’s not an inefficiency, it’s the mechanism by which the box dies. Set it low and the broker stops being a firehose and starts being a hand-off: take what you can finish, acknowledge it, ask for more. Throughput barely notices. Memory notices a lot. Concretely: default prefetch lets a single consumer buffer roughly 10000 messages before acknowledging any — at peak that’s 15 GB of image and clip payloads sitting in RAM we can’t reclaim. Dropped to a prefetch of 1000, that buffer never exceeds 1.5 GB. Sustained throughput moved by less than we could measure. Peak RSS on the consumer dropped by 13.5 GB, which is the entire reason the box survives 6 PM.
The last thing one broker bought us was a seam — one durable point everything funnels through, so a consumer going away doesn’t lose events. They queue. That seam is what the migration is built on, and it’s why it isn’t interesting.
Three Stacks, Three Disks — and Why Redis Sits in the Middle
Each of the three storage servers runs its own full stack: a consumer pulling from RabbitMQ, feeding its own Redis, feeding its own Celery workers, writing to its own disk. Three identical pipelines side by side, sharing nothing below the broker. No cross-server calls on the hot path, no coordination, no distributed lock.
Which raises the question everyone asks about ten seconds into the diagram: you already have a queue. What is the need for a second one?
The honest first answer is that Celery wants a broker and Redis was already on the box. But that’s why we could, not why we should have. The two queues are carrying opposite risks.
Ingest and processing run on different clocks. The consumer must drain the broker as fast as events arrive; Celery grinds at whatever CPU and disk allow, which at peak is slower than events arrive. That mismatch has to live somewhere. If the only buffer is the broker, it lives in shared memory across all seven servers — one slow disk becomes everyone’s queue depth. With Redis in between, the mismatch stays local: the consumer keeps draining, Redis absorbs the delta, Celery works it off during the lull. The evening surge doesn’t need the pipeline to be fast enough for peak. It needs somewhere to put the difference until 8 PM.
Backpressure has to be local to be useful. Each server has its own disk, fill rate, and backlog. When one falls behind, that’s information about that server — actionable there, not smeared across a shared queue where it reads as a site-wide problem. A single shared queue averages it away, which is the exact mistake this post opens by warning about.
And it contains the blast radius. If a Redis dies, one stack stalls. The broker holds the line, the other two keep working, the events stay durable. Share one queue and the same failure is a site-wide incident. Three small failure domains instead of one large one.
RabbitMQ is the fan-out: durable, site-wide, deliberately dumb. Redis is the shock absorber: local, fast, disposable. Same shape on a slide. Opposite jobs.
Near-Zero Scheduling Latency — and the Image Problem
The thing about “CPU-only bare metal” is that everyone assumes the CPU is the problem. It isn’t. This workload is I/O-bound almost end to end: pull from Redis, decode, run the logic, write bytes to disk. The cores spend most of their time waiting. Which means the default Celery instinct — prefork, one process per core, isolate everything — is exactly wrong here. You get a pile of processes each holding a full memory footprint, mostly blocked on disk. Thread pools with high concurrency fit the shape of the work: many in-flight writes, one process, one memory ceiling you can actually reason about. Scheduling latency drops to effectively zero not because the hardware is fast, but because there’s nothing queued behind a busy core — the task hits a worker the moment it’s published.
The disk is the real ceiling, and it isn’t the same ceiling on every box. These servers are not identical. Some are recent, some are genuinely old and genuinely slow, and the write speed spread between the best and worst is wide enough that a single tuning profile would have been wrong on at least two of the three. So concurrency is per-server, tuned to what that machine’s disk can actually absorb without the queue in front of it growing faster than it drains. The fast box runs hot. The old box runs at a number that would look embarrassing on a slide and is exactly right for the hardware.
Which sets up the fun problem. Three servers, three disks, three separate piles of images — and one dashboard, on one server, serving one URL namespace to users who have no idea any of this exists and shouldn’t have to.
Nginx as the Distributed Filesystem You Already Had
The naive fix is to copy. Sync the images back to the API server, serve them from there, done. That fails on arithmetic before it fails on principle: 20TB spread across three disks doesn’t fit on one, and the copying itself is write amplification on hardware that’s already at its disk ceiling. The other naive fix is to install a real object store — MinIO, Ceph, something with a logo. In an air-gapped site, that’s not a two-hour task. It’s a package that isn’t there, on a system that can’t go down, absorbing capacity that’s already committed.
So we asked a smaller question. The images are already on disks. Those disks are already on servers. Those servers already talk HTTP. What’s actually missing isn’t storage — it’s a name. One namespace where every image has exactly one URL, regardless of which box happens to hold the bytes.
That’s a reverse proxy. And nginx was already running on every one of those servers.
The routing rule is the part worth stealing, and it’s dumber than people expect. The server that processed an event is the server that wrote its image — shared-nothing, paying out. But the image URL carries no server in it, just a timestamp and a UUID, so at read time nobody knows which of the three disks holds the file. We don’t look it up. The main nginx has all three storage server IPs configured as ordered fallbacks: it tries the first, and if the file isn’t there, falls through to the second, then the third. No lookup service, no metadata layer, no consistent hash ring — the first server that has the file answers, and nginx streams the bytes back. The dashboard requests a URL. The URL resolves. Nobody involved knows or cares that the request may have tried two disks before finding the third — it just comes back. On a miss the cost is a wasted round-trip or two inside the rack, which at these sizes is cheap; the file is small and the servers are next to each other.
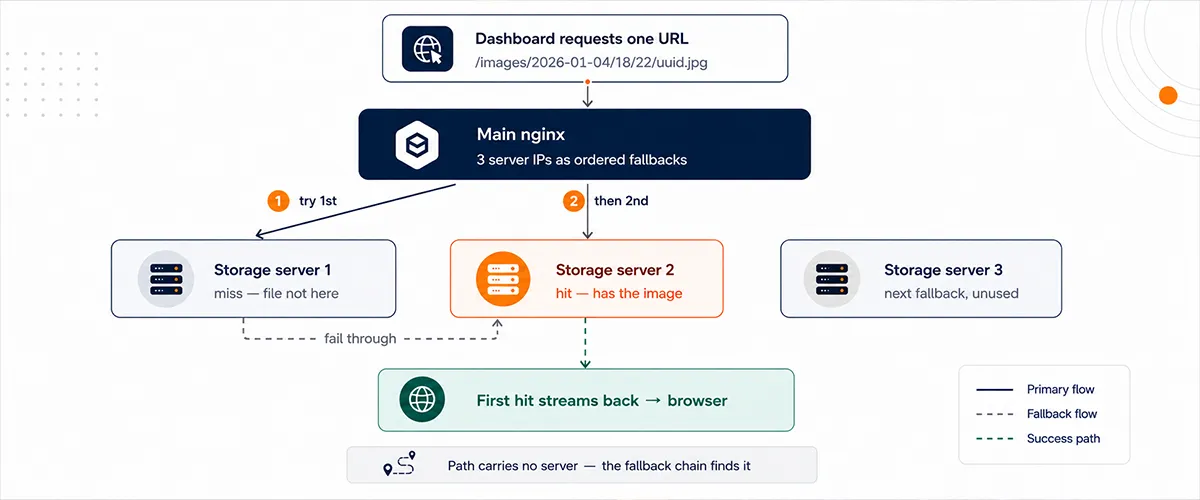
The API server ends up as a router that touches no image data. Bytes flow server → nginx → browser without landing on the API box’s disk or sitting in its memory. This matters more than it sounds: the one machine that can’t be allowed to fall over is also the one machine doing the least work per request. During peak, the dashboard is serving images pulled off three disks in parallel while its own disk stays idle.
A real object store would have given us replication, rebalancing, erasure coding — genuinely useful things we didn’t need, in exchange for a new dependency, new memory, a new failure mode, and an installation we couldn’t perform anyway. What we needed was fallback across servers. We had a tool that does fallback across servers, already installed, already running, already understood by everyone on the team.
The best distributed filesystem is sometimes just a config file.
Migrating a Live, Air-Gapped System Without Downtime
Every migration plan has a moment where someone says “and then we cut over,” and everyone nods, and nobody asks what happens in the ninety seconds between the old thing stopping and the new thing starting. We didn’t have ninety seconds. The cameras had opinions about that.
So there was no cutover. There was a slow, deeply anticlimactic slide.
Bring up one new consumer stack on one storage server, pointed at the same broker. Let it take a slice. Watch. Not “watch for errors” — watch the queue depth, because queue depth is the only honest metric during a migration. If it’s flat, the new path is keeping up. If it’s climbing, it isn’t, and you know that in seconds instead of discovering it in a support ticket at 6 PM. Then let the old backend’s share shrink. Then a second stack. Then a third. Then the old path is handling a trickle, then nothing, and then one day you turn it off and nobody notices, which is the highest praise a migration can receive.
At every step, backing out was the same shape as going forward. Nothing was destroyed. No data was moved. New images went to the new servers, old images stayed exactly where they were — and nginx genuinely does not care which era a file came from. The path resolves either way. There was no “migration of the data,” because the data never moved. We just changed who was writing new bytes and let time do the rest.
And the whole thing was done during the quiet hours, in slices, on purpose. The lull between 11 PM and 5 AM isn’t just when the load is low — it’s when the stakes are low. A mistake at 2 AM costs you a few thousand events sitting in a durable queue for eleven minutes. The same mistake at 5:30 PM costs you a bad afternoon and a phone call.
Nobody writes a blog post about the migration where nothing happened. That’s the point.
Failure Modes We Planned For
A server drops. Handled, and handled almost by accident. One machine going away is one machine going away. Its events stay in the broker, waiting. The other two keep working. When it comes back, its consumer drains and the backlog burns off. The failure is loud, contained, and boring — three properties you want in exactly that order.
Redis fills. This one we watched closely, because it’s the failure that lies to you. Redis filling isn’t a Redis problem — it’s a disk problem wearing a Redis costume. The shock absorber only works if the thing behind it eventually catches up, and if the disk can’t drain what ingest is pushing, memory just climbs until something gets ugly. So the depth metric per server isn’t a nice-to-have dashboard tile, it’s the early warning system for a disk that’s quietly falling behind, hours before it becomes visible anywhere else.
Disk hits 20TB. Not a failure, an inevitability. 20TB and ~3M events a day is a clock, not a limit. The interesting part isn’t retention policy — everyone has one — it’s that three independent disks don’t fill at the same rate. A uniform retention window across non-uniform disks means one box is dropping data it had room for while another is running out. Retention has to be per-server for the same reason concurrency is.
What We’d Do Differently
Build the per-server metrics first, not third. Queue depth, RSS, and disk fill per box turned out to be the only numbers that mattered — and we backed into all three after they’d already bitten us. Every “surprise” in this deployment was something that had been visible for hours in a place nobody was looking.
Stop trusting uniform config earlier. We tuned all three servers the same way for longer than we should have, on hardware that was never the same. The old box told us it was slow. We just kept averaging it into the group.
And the real one: none of this is clever. It’s a broker, a buffer, a proxy, and a refusal to pretend three disks are one disk. The engineering was in what we didn’t build. If we did it again, we’d get to that conclusion faster and skip the two weeks spent looking for a more impressive answer.
The Numbers
Events/day | 2.5–3M |
Peak throughput | 150K–200K/hour (40–55/sec sustained) |
Cameras | 700+ |
Servers | 7 (3 with storage) |
Storage | 20TB, distributed, no SAN/NAS |
Task scheduling latency | ~0 |
Downtime during migration | 0 |
New servers purchased | 0 |
New packages installed | 0 |
Three million events a day, on hardware that already existed, with a stack that was already installed, migrated underneath a live system that never stopped running.
The constraints didn’t limit the architecture. They wrote it. This is how Intozi engineering team builds – not around constraints, but through them.
Authors:

Sanskar Dwivedi, Software Development Engineer (SDE)

Akshat Pandey, Software Development Engineer (SDE)
Talk to our engineering team and explore how we build
Intozi Tech Pvt Ltd
Unit no- 629, 644, 645 Tower B2, Spaze I-Tech Park, Sohna Road Sec 49, Gurgaon, Haryana-122018
MON-FRI 09:00 - 20:00, SAT 10:00 - 14:00